Technical/scientific Challenge:
The primary technical challenge in unemployment measurement and analysis is the reliable orchestration of heterogeneous labor-market data and analytical capabilities within a single, consistent workflow. In practice, unemployment analytics spans multiple data „realities“ at once: administrative registers, regional time-series, demographic attributes, sectoral structures, programme participation records, and macroeconomic indicators – each with different schemas, update cycles, and quality constraints. This creates a persistent interoperability problem: integrating new datasets or changing reporting requirements often results in one-off pipelines, duplicated logic, and inconsistencies across regions and periods, making it difficult to maintain comparability and methodological stability over time.
Another challenge is computational and cognitive: labour-market analysis frequently requires multi-step reasoning (regional comparison -> dependency analysis -> forecasting -> cohort segmentation -> narrative reporting), but the number of possible data fields, indicators, and analytical paths quickly becomes too large to manage reliably in a single step. Without a disciplined mechanism for narrowing scope, selecting only the relevant signals, and enforcing stepwise execution, complex workflows become prone to noise, missed factors, and irreproducible outcomes – especially when the same analysis must be repeated monthly or expanded across many regions.
The governance and security dimension is essential. Labor-market datasets often include sensitive or quasi-identifying attributes, which raises strict requirements for data minimization, controlled access, and traceability of analytical actions. Any advanced analytics architecture must therefore address the challenge of enabling semi-autonomous analysis while enforcing granular permissions, maintaining isolation between datasets and outputs, and providing auditable provenance for how results were produced. Without such guardrails, even accurate analytics may be operationally unusable in a public-sector context due to compliance, accountability, and trust constraints.
Solution:
A multi-agent analytics workflow was implemented to support unemployment measurement and analysis through coordinated tool execution rather than single-shot text generation. The system was used to run recurring analytical tasks – data exploration, forecasting, segmentation, and optional integrity checks – while keeping the same methodological steps applicable across periods and regional cuts.
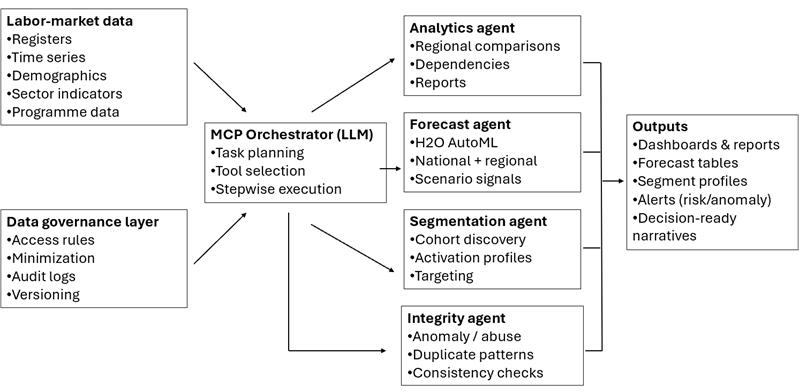
Figure 1. Multi-agent unemployment analytics workflow
The workflow relies on the Model Context Protocol (MCP) as an integration layer between the LLM interface and external analytical tools. MCP was selected because it provides a standardized way to expose tools (e.g., data loading, modelling, reporting) to the model without building custom integration logic per task. This separation between orchestration (task planning and step ordering) and execution (tool calls that produce measurable artifacts) supports consistent reproduction of the same workflow when the input data, region, or target variable changes.
In practice, MCP was used to structure the system as a set of callable capabilities (tools) that can be invoked in a controlled sequence (e.g., load dataset – validate schema – run analysis – train/score model – generate outputs). This design reduced dependency on ad-hoc manual steps and improved repeatability of results across runs.
The implemented setup uses specialized agents with bounded responsibilities, coordinated by the orchestration layer:
- Data analysis and descriptive statistics (H2O-supported analytics) – Data exploration and comparison were performed for national and regional views, with emphasis on:
- cross-region comparisons and trend inspection
- identification of relationships and dependencies that are relevant to unemployment dynamics
- education -> employability, age -> unemployment risk, and sector structure -> regional vulnerability
- production of structured analytical outputs (tables/plots) that summarize differences between regions and periods.
- Unemployment forecasting (H2O AutoML)
Forecasting was implemented using H2O AutoML as the modelling component. The approach uses historical data, seasonal patterns, and selected indicator variables to train and evaluate multiple candidate models and to select a best-performing model for the target. Forecasts were generated at:
- national level
- regional level (oblast/region), with the ability to stratify by age group and sector when the corresponding fields are available
The forecasting workflow produces forecast series together with model evaluation information and interpretable outputs suitable for reporting (e.g., trend/forecast plots and forecast tables).
- Segmentation of jobseeker groups (H2O clustering/segmentation)
Segmentation was implemented to support cohort-level analysis and targeted activation planning. The clustering logic groups individuals (or aggregated profiles, depending on data granularity) using variables such as age, education, experience, region, profession, and behavioural indicators. The output is a set of cohort profiles that can be interpreted as operational categories (e.g., young graduates without experience; long-term unemployed; low-skilled in rural areas), enabling differentiated programme considerations instead of treating unemployment as a single homogeneous population.
- Optional integrity/anomaly monitoring (H2O-based detection)
An additional monitoring step can be applied to detect atypical patterns and potential data issues, such as unusual spikes, inconsistencies, or duplicate-like behaviours. The purpose of this component is to support data integrity and to highlight records or aggregates that require expert review before being used in reporting or decision support.
For interaction, the workflow was operated through the ChatGPT Desktop client, used as a natural-language entry point for analysts. Requests expressed in domain language were translated into a sequence of tool executions, and the system returned both narrative summaries and structured artifacts.
Scientific impact:
The scientific contribution of this work can be outlined in several key directions:
- Protocol-based AI orchestration – the work demonstrates how a protocol-driven integration layer (MCP) can separate orchestration from execution, enabling repeatable, tool-based analytics workflows instead of single-shot text generation.
- Natural language as an operational interface – the system shows how domain-level requests (e.g., forecasting, cohort segmentation, regional comparison) can be translated into controlled sequences of analytical tool executions, lowering the interaction barrier while preserving methodological structure.
- Reproducible predictive modelling via AutoML – by using H2O AutoML, the modelling process (training, evaluation, selection of best-performing candidates) becomes systematic and repeatable across regions, time periods, and target variables, supporting consistent forecasting baselines.
- Cohort-level analytical methodology for labour-market interventions – the segmentation workflow formalizes how unemployment populations can be represented as interpretable cohorts, supporting targeted activation planning and enabling comparative analysis of group dynamics over time.
- Data integrity as part of the analytical lifecycle – the optional anomaly/integrity step introduces a systematic mechanism for identifying atypical patterns and potential inconsistencies prior to reporting or decision support, improving the reliability of downstream analytics.
- Generalisability – while applied to unemployment measurement and analysis, the same orchestration + AutoML + segmentation methodology is transferable to other public-sector analytics domains that require periodic reporting and regional comparability.
Benefits: - Methodological consistency across reporting cycles -the same analytical workflow can be reproduced across periods and regional cuts, reducing fragmentation and increasing comparability.
- Higher analytical throughput – recurring tasks (exploration, forecasting, segmentation, reporting outputs) can be executed faster due to coordinated tool execution and reduced manual handling.
- Forecast-driven early signals – regional and stratified forecasts (where fields allow) provide earlier indication of rising unemployment risk, supporting proactive planning rather than reactive response.
- More targeted activation planning – cohort segmentation produces interpretable group profiles, enabling differentiated programme design instead of uniform measures for heterogeneous populations.
- Improved reliability of outputs – the integrity/anomaly monitoring step can flag atypical patterns and potential data issues, supporting expert review before results are used in reporting or decision support.
- Lower barrier for non-technical users – operating the workflow through the ChatGPT Desktop client allows analysts to trigger complex multi-step processes using domain language, while still receiving structured artifacts (tables/plots/forecasts/segment profiles).
- Auditability and traceability of analytical actions – stepwise execution produces intermediate artifacts and outputs that can be reviewed and validated, strengthening transparency in institutional analytics.
Success story # Highlights:
- Protocol-driven, repeatable analytics workflows – unemployment analysis tasks are executed as structured tool pipelines rather than ad-hoc scripts or single-shot text outputs.
- Forecasting at national and regional levels with AutoML – H2O AutoML standardizes model training and selection, enabling consistent forecasting baselines across time and regions.
- Cohort segmentation for targeted measures – unemployment populations are transformed into interpretable cohorts to support activation planning and differentiated programme considerations.
- Integrity-aware analytics – anomaly/integrity monitoring can be integrated as a validation layer to increase trust in reported indicators.
- Natural-language operation with structured outputs – analysts interact through ChatGPT Desktop while receiving concrete artifacts (tables, plots, forecasts, segment profiles) suitable for reporting
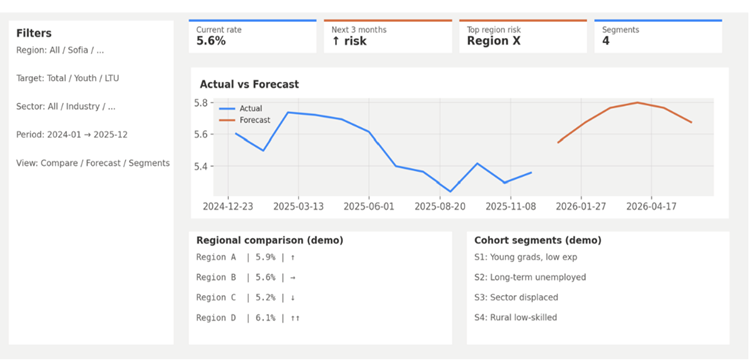
Figure 2. Consolidated dashboard view of forecasting, regional comparison, and cohort segmentation. The screen combines (i) actual vs forecast unemployment series, (ii) a regional comparison summary, and (iii) cohort segment profiles used for targeted activation planning.
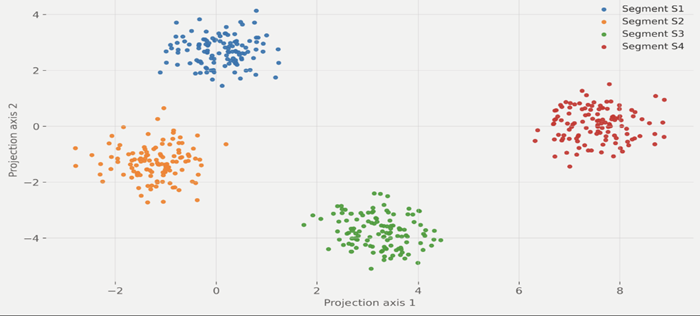
Figure 3. Segmentation of jobseeker groups. Two-dimensional projection of the feature space used for segmentation, illustrating separation of jobseeker cohorts into distinct clusters. Cluster assignments support cohort profiling and targeted activation planning; descriptive profiles are derived from dominant feature patterns within each cluster.
Contact:
- Chief Assist. Dr. Ivona Velkova, [email protected]
- Prof. Kamelia Stefanova, [email protected]
- Prof. Valentin Kisimov, [email protected]
University of National and World Economy, Bulgaria