Scientific/governmental/private partners involved
Security Solutions Institute Ltd. – a research and applied-technology center within PIM Prima AD that helps enterprises across Southeastern Europe protect and govern their information assets.
Technical/scientific Challenge
In the process so far, the following workflow has been built and tested:
- Created and improved a prompt initiated through a web interface by the end user.
- Dispatched one user prompt to three state-of-the-art LLMs (at the time of implementation – OpenAI GPT-4o, Anthropic Claude 3.5, Google Gemini 1.5).
- Merged their responses pair-wise (EasyPeasy.ai or an LLM reasoning merge) into a single, richer draft.
- Ran automatic quality assurance passes for grammar (Trinka) and originality (Copyleaks).
- Applied a final LLM polish to unify tone and style.
- Exposed the entire process in a web interface where end users could trigger the run, inspect intermediate outputs, and approve or request refinements.
This pipeline solves the text-quality problem but it has left the visual storytelling to human analysts, who need to spend time plotting charts, and inserting them into reports manually. Analysts must be able to decide whether visuals are needed, choose chart/diagram types (bar, line, pie, heat-map, network, sequence), and state any additional preferences. The system infers or synthesizes the minimal dataset that makes each point understandable.
All diagrams are produced by short, self-contained Python scripts generated by the LLM, executed in a locked-down sandbox (for security reasons, since the code might include potential attacks or vulnerabilities). Images appear directly after the paragraphs they illustrate, with captions and alt text for WCAG 2.2 compliance.
Beyond text checking, the platform needs runtime validation (no Python errors, non-empty images, labeled axes, readable fonts).
Solution
User-facing Web Interface — Visual-Aware Prompt Builder
The existing front-end is extended with a second section titled “Visual Options” (Fig.1):
- Chart / Diagram Types (multi-select) – Pick from bar, line, pie, heat-map, radar, network graph, sequence diagram, “other”.
- Quantity – Max number of visuals desired.
- Stylistic Hints – Optional brand colors, font size, aspect ratio.
Back-end Pipeline
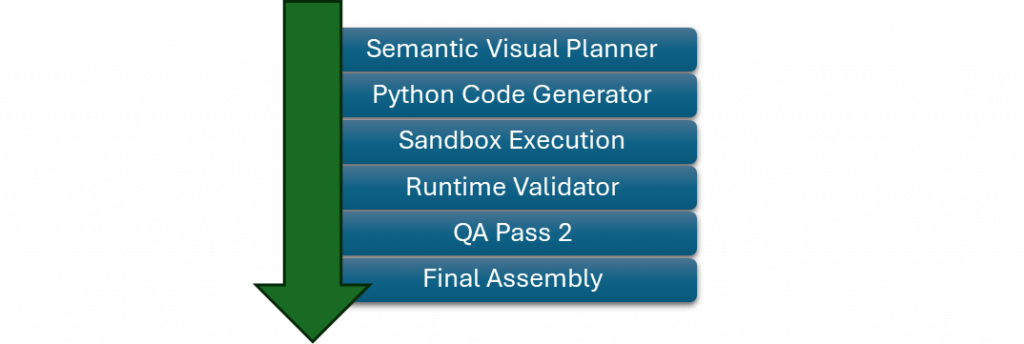
Semantic Visual Planner – the Generative AI tool (OpenAI GPT-4o) scans the merged resulting text, detects numeric patterns, ordinal lists, risk taxonomies, and matches user-requested chart types to the most relevant content. It inserts stable placeholders, for example: <<FIG_2_PIE:RISK_DISTRIBUTION>>.
Python Code Generator – For every placeholder, the Generative AI tool produces a stand-alone Python script that: 1) builds an in-memory DataFrame (synthetic or extracted numbers); 2) renders the chosen matplotlib / graphviz figure with labels, title, legend; 3) writes a PNG to /tmp/fig_<hash>.png; 4) prints a JSON payload containing alt text.
Sandbox Execution – Scripts run inside a Docker container with CPU / memory limits; outbound network disabled.
Runtime Validator – Checks: zero exit code, PNG exists & >1 KB, axes labeled, font size ≥9 pt. Failures trigger regeneration (max 3 attempts) or placeholder flag for manual review.
Quality assurance (QA) Pass 2 – the Generative AI tool performs the final polish plus caption refinement (It is the 2-nd pass, since the original workflow already has a quality assurance phase).
Final Assembly – Place images, captions, and alt text at placeholders.
Text merging/QA (proven in phase 1) remains untouched, ensuring continuity. The new visual branch hooks in after QA Pass 1, so grammatical or factual corrections happen before chart generation.
By inserting IDs like FIG_2_PIE:RISK_DISTRIBUTION, downstream components know exactly which script produces which image and where to place it. This allows storing the Python scripts for human verification and potentially adjustment, if necessary.
Even though the code is LLM-generated, resource limits and mandatory validation guarantee no harmful side-effects and visual quality. This is important since potential prompt injections could lead to generating Python code that might cause security issues.
Scientific impact
- Demonstrates that a workflow of Generative AI tools and systems can infer supportive datasets and select the most persuasive visual form.
- Provides a reference for running AI-written code for visual component generation inside secure systems and networks.
- Combines machine generation with analyst curation, shortening iterations while preserving expert oversight.
- Benefits
- Richer deliverables to the customers of SSI – incident-trend lines, vulnerability heat-maps, attacker-path graphs and other kinds of charts and diagrams that would be beneficial for better understanding of the reports appear automatically.
- Consistent visual standards without extra design steps.
- All generated documents pass WCAG 2.2 accessibility checks and internal cyber-security audits.
Success story # Highlights
- Introduces a visual-aware prompt builder and semantic visual planner powered by reasoning-first large language models.
- Implements a method to generate and insert charts and diagrams into the context of the generated text.
- Implements a secure sandbox and validator so that auto-generated Python charts remain both safe and high quality.
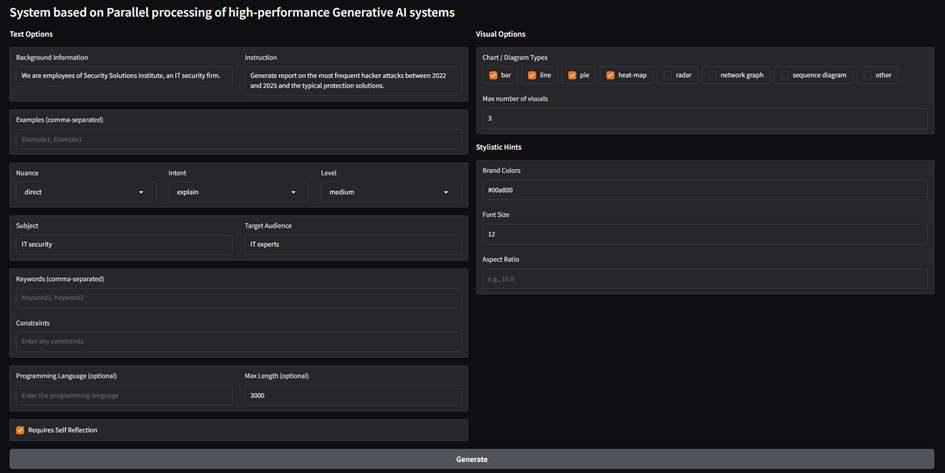
Figure 1: Setting up the visual information requirements alongside the initial prompt building.
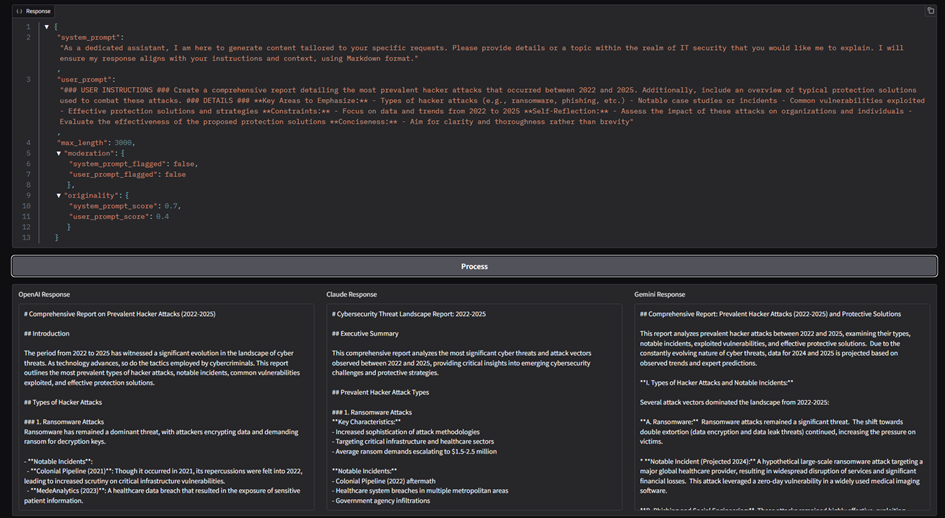
Figure 2:Structured prompt and results from the three tools by OpenAI, Anthropic and Google
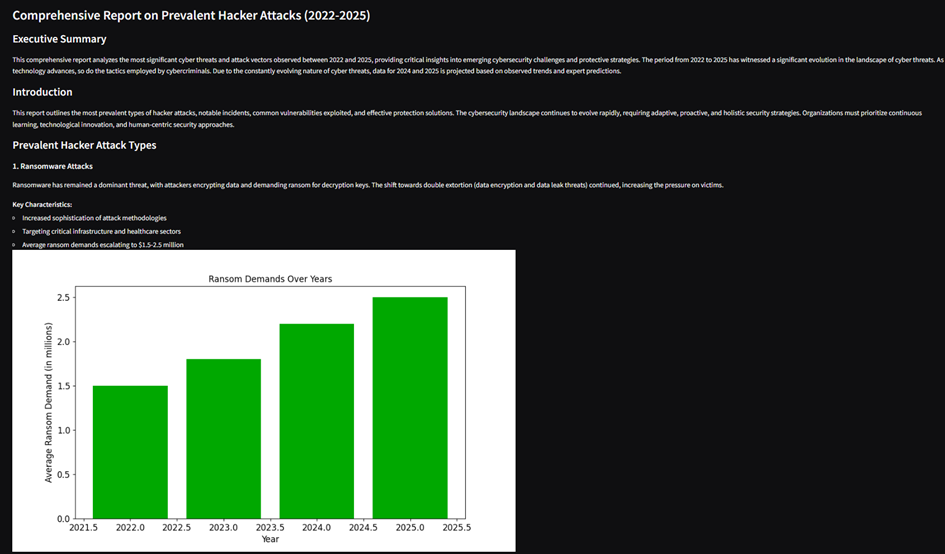
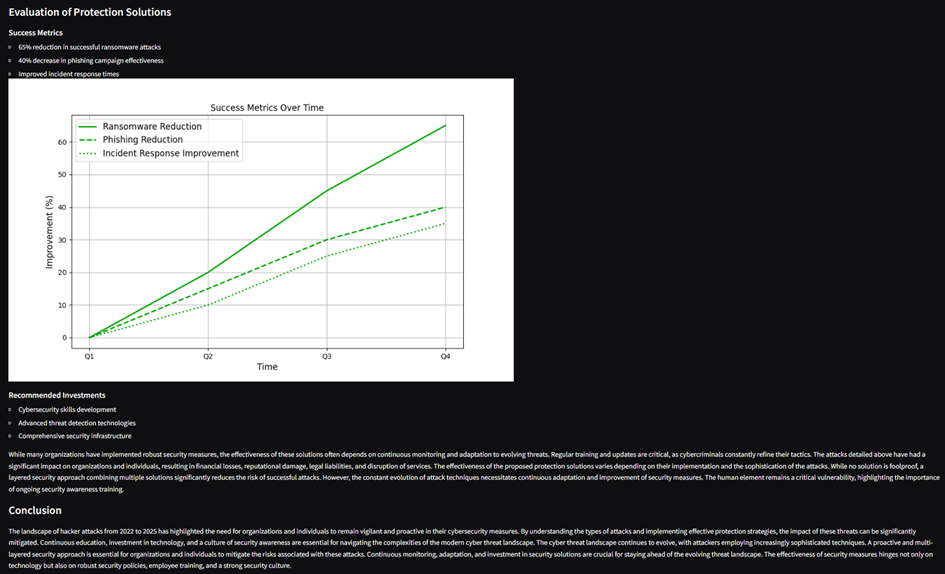
Figure 3: Final report containg multiple charts related to the content and in line with the requirements provided in the starting screen.
Contact
- Venko Andonov, [email protected], University of National and World Economy, Sofia
- Valentin Kisimov, [email protected], University of National and World Economy, Sofia